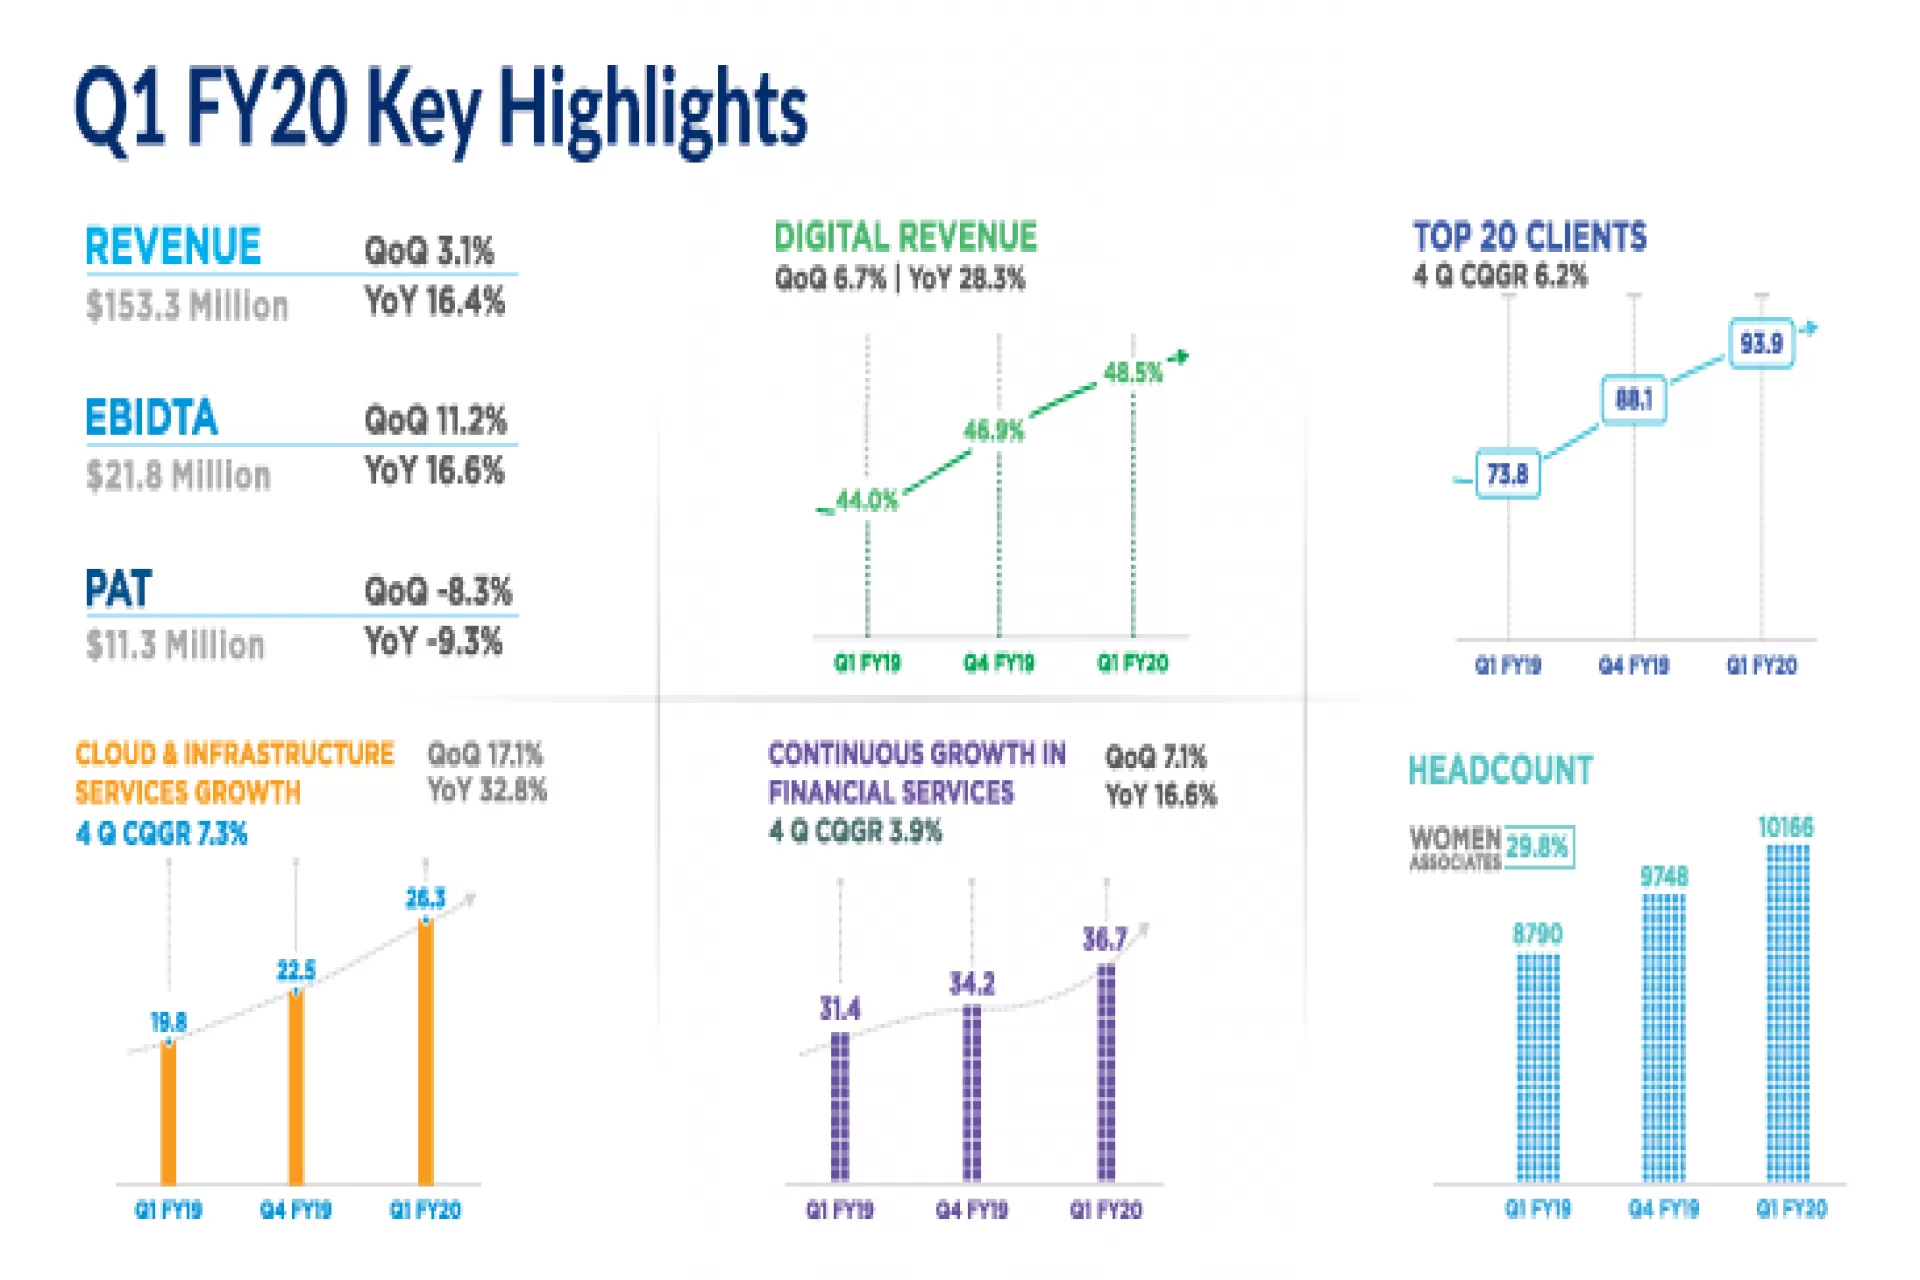
Zensar reports 16.4% YoY revenue growth; records 9th consecutive quarter of growth Digital is at 48.5% of revenues
Press Release | 6 Aug 2019
Pune, India, August 6, 2019: Zensar Technologies, a leading digital solutions and technology services company that specialises in partnering with global organisations on their Digital transformation journey, announced its audited consolidated financial results for its first Quarter ending June 30, 2019 of the fiscal year 2019-2020.
Financial Highlights: The Company reported YoY revenue growth of 16.4% at close of Q1FY20 from 131.7 M USD to 153.3M USD and 3.1% sequentially. The PAT for the quarter is at 7.4% of the revenue. Digital revenues continue to grow and have moved up by 28.3% YoY and is now 48.5% of Q1FY20 revenue.
Sandeep Kishore, Chief Executive Officer and Managing Director, Zensar Technologies said, “Digital has grown significantly this quarter, contributing 48.5% of the overall revenues fuelled by the exponential growth in our Cloud, Digital Led next gen CIS business posting approximately 70.3 % YoY growth. Our total order booking for this quarter has been 160 M USD TCV.”
Navneet Khandelwal, Chief Financial Officer, Zensar Technologies said, “The EBITDA has shown an increase, both in sequential and YoY terms at 11.2% and 16.6% respectively. We continue to maintain a prudent cost management strategy with a focus on improving operating metrics. All regions have posted a positive growth in constant currency terms.”
A. Significant Wins Q1FY20:
- Digital Transformation for Sanlam, a leading insurer from South Africa
- Application and development mandate for a large US based hi-tech global company
- Application, integration and support for a leading financial services group in South Africa
- A multi-million-dollar deal for the digital transformation for a UK based conglomerate having diverse interests
- Infrastructure Management for a leading South Africa based administration and technology provider to financial companies
- Guidewire support for one of UK's fastest growing general insurance providers
- Digital warehouse mandate and automated testing for a global sports company
- Application Support and Enhancement and Application Development and Integration for an independent provider of private healthcare in UK
B. Corporate Excellence Snapshot in Q1FY20:
- Zensar mentioned in the Gartner Magic Quadrant for Oracle Cloud Application Services, Worldwide 2019
- Zensar mentioned in Gartner Critical Capabilities for Oracle Cloud Applications Services, Worldwide 2019
- Hfs mentions Zensar as a rising mid-tier company
- Global data covers Zensar’ s RoD Conclave Analyst and Advisor Day
- Zensar mentioned in the Gartner Magic Quadrant for Data Center Outsourcing and Hybrid Infrastructure Managed Services 2019
- Gartner Critical Capabilities for Managed Mobility Services Global
- ISG Provider Lens Cyber Security Solutions and Services
- Everest Group Digital Workplace Services PEAK Matrix assessment
Note: All numbers are as per the Ind-AS reporting standard without RoW
Q1 FY 20 Revenue and profitability snapshot (US$)
|
Particulars |
Q1 FY20 |
Growth |
||||||
|
USD Mn |
INR Cr |
Q-o-Q |
Y-o-Y |
|||||
|
USD |
INR |
CC |
USD |
INR |
CC |
|||
|
Revenue |
$ 153.3 |
₹ 1066.1 |
3.1% |
1.8% |
3.6% |
16.4% |
20.8% |
18.8% |
|
EBITDA |
$ 21.8 |
₹ 151.5 |
11.2% |
9.8% |
|
16.6% |
21.0% |
|
|
EBIT |
$ 16.3 |
₹ 113.6 |
1.9% |
0.6% |
|
2.3% |
6.1% |
|
|
PAT |
$ 11.3 |
₹ 78.7 |
(8.3%) |
(9.5%) |
|
(9.3%) |
(5.8%) |
|
Q1 FY 20 Revenue Growth in Constant Currency
|
Particulars |
Segments |
Q2 FY19 |
|
QoQ |
||
|
Consolidated |
For the Company |
3.6% |
|
Geography |
US |
2.3% |
|
Europe |
4.0% |
|
|
Africa |
14.7% |
|
|
Services |
Digital and Application Services, DAS |
1.1% |
|
Digital Services |
3.4% |
|
|
Core Application Services |
(1.1%) |
|
|
Cloud and Infrastructure Services, CIS |
17.3% |
|
|
Cloud, Digital Led next gen CIS |
36.5% |
|
|
Core Infrastructure Services |
15.3% |
|
|
Third Party Maintenance |
(4.5%) |
|
|
Total Digital Services |
7.2% |
|
|
Industry |
Hitech and Manufacturing |
5.8% |
|
Hitech |
2.8% |
|
|
Mfg. |
15.6% |
|
|
Retail and Consumer Services |
(10.2%) |
|
|
Financial Services |
8.2% |
|
|
Insurance |
4.2% |
|
|
Banking |
21.9% |
|
|
Emerging |
20.8% |


